7 Must-Have Elements for an Effective Higher Ed Homepage
Your institution’s higher education homepage should stand as a testament to your values AND resonate with mission-fit students. These seven elements will make your homepage unstoppable!
social media
So you’re an enrollment marketer who wants to get more out of your school’s social media marketing, but you’re no social media analytics guru? That’s okay.
I’ve written on the topic of social media analytics in the past, but for this post I’ll get a little more in detail about where to put your focus.
Why? Because one look at today’s analytics dashboards, and it’s easy to get overwhelmed.
Thankfully, getting started can be a lot simpler than you think.
There are three levels of indicators – let’s just say “stuff to measure,” shall we? – when you’re analyzing your social media performance.
This means a key question you need to ask yourself, if you haven’t already, is “What action do I most want my audience to take?”
KPIs can be:
Now, let’s walk through how to read analytics for meaningful information, connect your primary indicators to KPIs, then use that data to analyze your progress and prove ROI.
You can’t start until you know where you are. This is often the biggest hurdle for enrollment marketers. With so much data to analyze, where do you look?
Let’s break down the social media analytics dashboard for three social media networks you’re probably on – Facebook, Instagram, and Twitter – and one you might not be on yet, but should consider: TikTok.
Finally, you need to take a look at the other side, too. Your website analytics will show you what traffic you’re receiving from social media and how that traffic relates to your KPI(s).
Record the indicators below in a spreadsheet, or whatever method you’re comfortable with.
If you haven’t already switched from the classic Facebook desktop design to the new one rolled out in early 2020, I suggest you do. It’s a much cleaner, simpler design, and you’ll likely have to switch to it soon anyway.
To get to Facebook Insights in the new design, simply navigate to your page and look for Insights on the left side of your screen, under Manage Page.
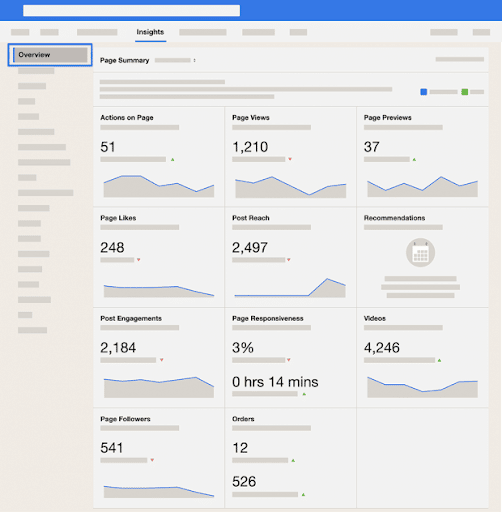
This is the big picture for primary indicators for whatever period of time you want to look at. The default is the last 7 days. I’d suggest looking at the last month (28 days).
It looks like this:

Image source: Facebook
If you’re just getting started with social media analytics tracking, I’d suggest you definitely record the following:
If you have been routinely publishing video content, check out the number of views (a “view” is minimum 3 seconds), and also record:
There may be other indicators to check, depending on your strategy. For example, if your goal is to use your page to convert visitors to event attendees, you definitely want to track Actions on Page. (While this can work, I typically recommend driving visitors back to your website instead.)
As it is a mobile-only platform, Instagram Insights is only viewable from your mobile device. If you haven’t already made your account an official business account, you’ll need to before you can get social media analytics data.
Tap the hamburger icon (three stacked horizontal lines) in the upper-left corner of your screen, and then tap Insights to access the dashboard.
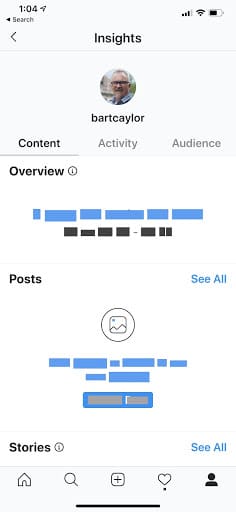
There are three main tabs from left to right: Contact, Activity, and Audience. I’d suggest you start in Activity.
It looks like this:

Record the following:
Scroll down to look under Discovery, and record these numbers as well:
The first thing to do if you’re new to Twitter Analytics is to turn analytics on. You do this by clicking on the Tweets tab (between Home and More) and clicking on the Get Started button.
You’ll immediately be shown your dashboard.
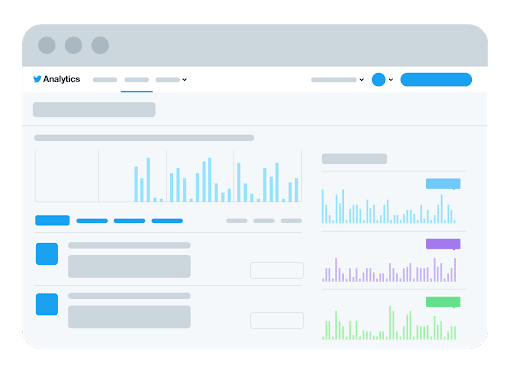
The TAD is pretty straightforward. The default setting shows you results over the last 28 days.
It looks like this:

Image source: Twitter
If you have a strong video strategy, you may also want to check out your Video Activity Dashboard (VAD).
There are just a few basic indicators I suggest you record from your TAD:
From the Trends section of your VAD (right-hand margin), you’ll want to record:
Just like with Instagram, you need to have a pro account to access TikTok Analytics. On your mobile device, tap the three dots in the upper-right corner to access Settings, select Manage my account, and tap Switch to Pro Account.
Then tap Explore Analytics to access the dashboard immediately. As a “business” or “creator,” you can also access Analytics through your Settings menu, where it appears as an option from now on.
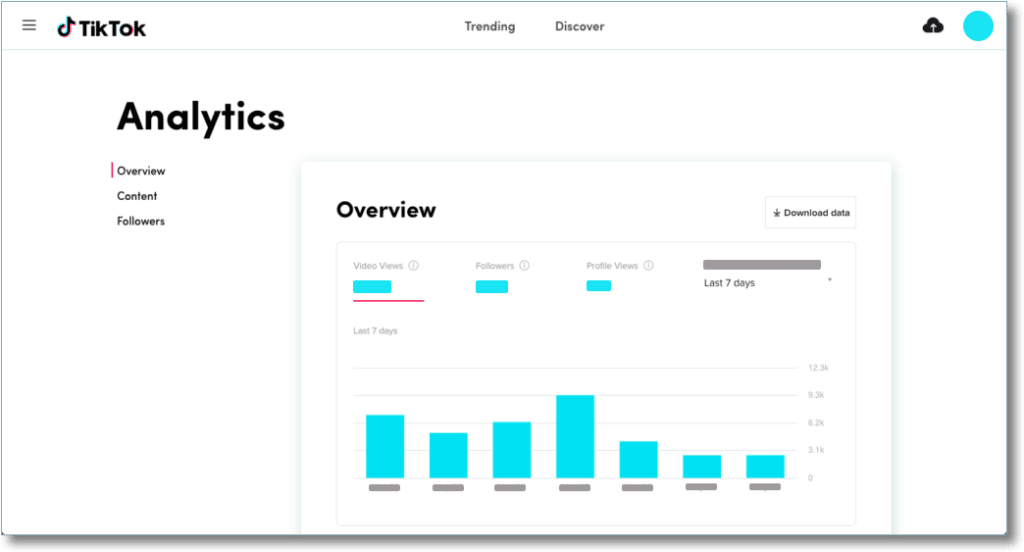
You can choose to view your 7-day or 28-day history. Just like with the others, I suggest you start with 28 days.
It looks like this:

I suggest you record the following basic indicators:
Finally, you need to take note of where your KPIs stand over the same time period (the last 28 days). These are the actions you most want your audience to take.
This will vary, depending on what those KPIs are. For the sake of simplicity, let’s assume your focus KPI is some type of form submission. Check whatever dashboard you use, e.g. Google Analytics (or with your IT department), to determine:
Divide the number of form submissions by total traffic, and you’ll have your conversion rate:
Example: 250 form submissions / 10,000 visitors from social media = 2.5% conversion over last 28 days
You now know exactly what the value of your overall social media presence is in relation to your focus KPI. Now you’re ready to make a hypothesis. Make it something simple, like this:
“If we try X, we will increase our primary indicators by Y, which in turn will increase our KPI by Z.”
Whatever X is, it should be focused on more than awareness. To move the needle, you need to strive for engagement and subsequent lead generation (form submission).
To make a good hypothesis, go back to your dashboards and look beyond activity to content and audience.
Facebook, Instagram and TikTok all have Content tabs in their Analytics tools that give you an idea what kind of content your audience responds to well.
What do the prospective students, their families and alumni in your audience seem to get the most excited about? The Content tab will help you figure that out.
The other important piece of information to consider is your actual audience – not to be confused with your target audience.
In other words, forget for a second who you’re trying to reach. Who are you actually reaching? That will help you decide whether to lean into a trend you didn’t expect, or realize you’re heading in the wrong direction and reverse course.
Facebook, Instagram and TikTok all have Audience tabs that provide this useful information.
Twitter is all about the numbers. In the absence of audience details, creating a hypothesis is pretty simple. It boils down to looking at Top Tweets in your TAD, looking for common characteristics of those tweets and trying to repeat it.
Chances are, your videos are likely getting the best engagement on Twitter. It’s never a bad idea to try more video to try to increase tweet-to-profile and Twitter-to-website traffic.
Now that you’ve done the tough parts – finding the data, recording the data and applying strategic thinking – all you have to do is implement your hypothesis and set a date to record results.
Whatever tweak you decide to make to your content, content type, frequency of posting, etc., put the plan in motion and stick with it until your check-in date. I’d suggest giving it at least another month (28 days in analytics terms).
If you’re committed to responding to comments, messages, etc. within 24 hours – or better yet, 12 hours – make that your top priority.
Nothing kills a social media strategy faster than forgetting to be actively social!
At the appointed time, go back and see how you’ve done.
If you’ve done well, keep it up (and don’t forget to report the proof of ROI to your superiors!). Set a higher goal and keep climbing.
If your intervention had little to no effect, just try something else. Failure is not a problem as long as you’re willing to try something else and record your progress.
Repeat this process. Set dates on the calendar for social media analytics review, at least once a quarter. I guarantee it will be worth it.
Data never ceases to be valuable, whether it tells you what you want to hear or not.
It’s even valuable to track your lack of progress.
If your team has gone through a tough time that has reduced your output – a lot of turnover, budget cuts, etc. – it helps to see the downturn. That only further proves the effectiveness of the strategy when you were executing it well. It helps you argue that returning to it is a smart move.
In other words, I’m saying that social media analytics are almost more important than activity. They give your actions meaning. They help everyone see the value of what you do, and help you do it better.
I want to see higher ed institutions like yours attract more of the ideal audience for your schools. Getting comfortable with social media analytics is a big part of that.
So if you need help with this, please let me know. As always, my team and I are eager to help you get the most out of your social media marketing efforts.
You’re in luck! We’ve curated 25 awesome ideas inspired by top higher ed institutions across the country and put them in one handy guide: 25 Ideas for Great Admissions Content.
 In this brand new resource from Caylor Solutions, you’ll get…
Get inspired.
Get enrollment results.
Get 25 Ideas for Great Admissions Content.
Download your copy today!
Featured image by NicoElNino via Adobe Stock
Subscribe to The Higher Ed Marketer podcast today!